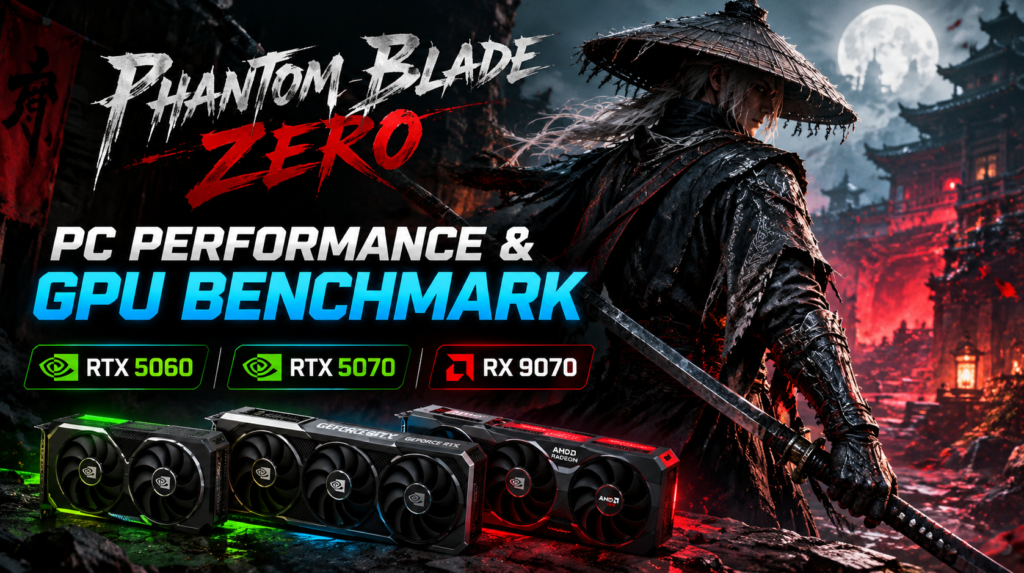
Phantom Blade Zero PC Performance & GPU Benchmarks: RTX 5060, RTX 5070 & RX 9070
Phantom Blade Zero PC Benchmark Overview
Phantom Blade Zero features demanding visuals and advanced rendering technologies, including Ray Tracing and Path Tracing. But how well does it run on different graphics cards?
In this benchmark, we test three GPUs from NVIDIA and AMD: the GeForce RTX 5060, RTX 5070, and Radeon RX 9070. Our testing covers 1080p, 1440p, and 4K resolutions, exploring different graphics presets, DLSS 4, FSR 4.1, Ray Tracing, Path Tracing, and Frame Generation.
We also examine average FPS and 1% lows to provide a better understanding of the actual gaming experience.
Each GPU is tested using selected graphics settings and supported technologies. Since the presets and upscaling configurations differ between GPUs, the results should be viewed as individual performance tests rather than a direct apples-to-apples comparison.
Let’s take a closer look at how these three graphics cards handle Phantom Blade Zero.
Test System & Benchmark Methodology
All three graphics cards were tested on the same PC configuration, using the same Windows installation, game installation, and benchmark scenes to maintain consistency throughout the testing process.
PC Specifications
| Component | Specifications |
|---|---|
| CPU | AMD Ryzen 5 7500F |
| Motherboard | ASUS TUF Gaming X670E-Plus WiFi |
| RAM | XPG Lancer Blade RGB DDR5-6000 32GB CL30 |
| GPU 1 | XFX Radeon RX 9070 Quick Silver OC 16GB |
| GPU 2 | ZOTAC GeForce RTX 5070 Solid OC 12GB |
| GPU 3 | GIGABYTE GeForce RTX 5060 Gaming OC |
| CPU Cooler | ID-Cooling FX360 INF 360mm AIO |
| Storage | XPG GAMMIX S70 Blade PCIe Gen4 M.2 2TB |
| PSU | Leadex VII Platinum PRO 1000W ATX 3.1 |
| Case | DarkFlash DK431 |
| Operating System | Windows 11 Pro 25H2 64-bit |
Graphics Drivers
- NVIDIA: GeForce Game Ready Driver 621.01
- AMD: Radeon Software Driver 26.10.1
Benchmark Methodology
Each GPU was tested individually using the same gameplay scenes and benchmark routes at 1080p, 1440p, and 4K resolutions. The same Windows and game installations were maintained throughout testing to ensure a consistent testing environment.
The benchmarks cover different graphics presets, Native Rendering, Ray Tracing, Path Tracing, and available upscaling and frame generation technologies, including NVIDIA DLSS 4 and AMD FSR 4.1.
We recorded average FPS and 1% lows to evaluate overall performance and frame-rate consistency.
Although all three GPUs were tested in the same gameplay scenes, graphics presets and available technologies differ between them. These differences are clearly identified when presenting the results, allowing readers to understand each GPU’s performance without assuming every test represents an identical graphics configuration.
NVIDIA GeForce RTX 5060 Performance
The GeForce RTX 5060 was tested at 1080p, 1440p, and 4K resolutions using different graphics presets and NVIDIA rendering technologies, including Ray Tracing, Path Tracing, DLSS 4, and Multi Frame Generation.
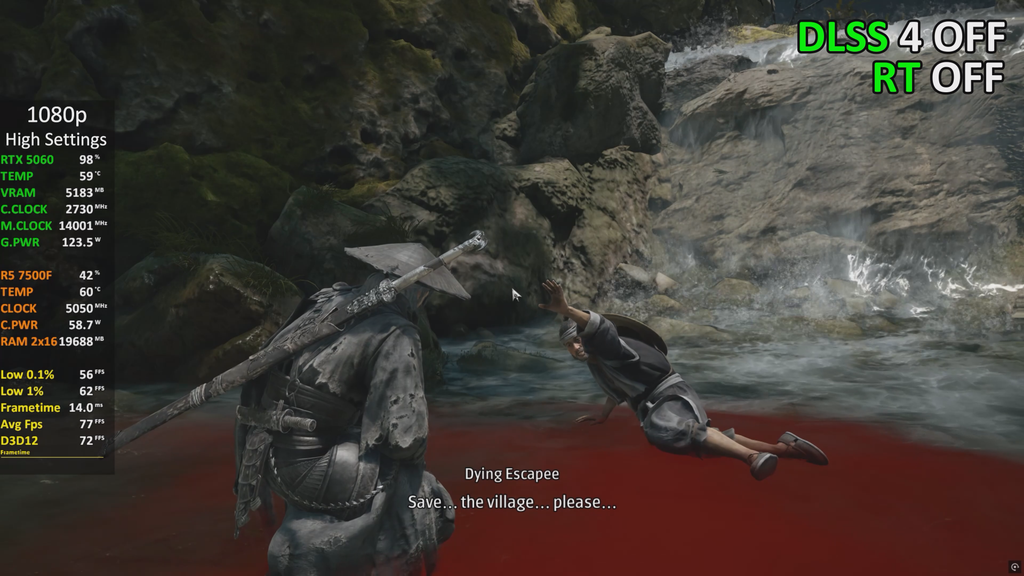
At 1080p with the High graphics preset and native rendering, the RTX 5060 delivered an average of 77 FPS, with 1% lows of 56 FPS.
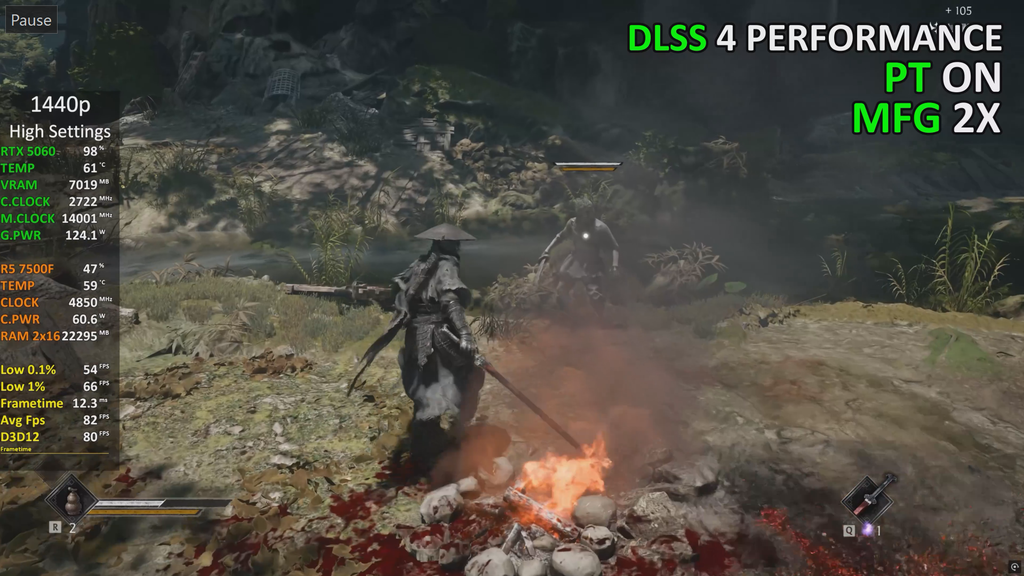
Moving to 1440p, we enabled Path Tracing alongside DLSS 4 Performance and Multi Frame Generation 2X. With these settings, the GPU achieved 82 FPS on average, with 1% lows of 54 FPS.
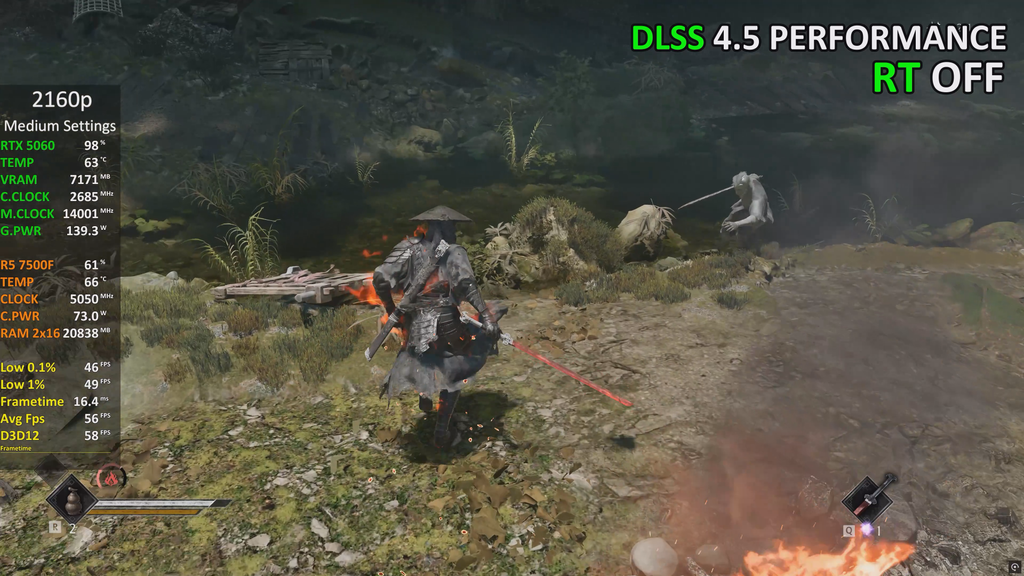
At 4K resolution, we tested two upscaling configurations using the Medium graphics preset. DLSS 4 Quality delivered an average of 47 FPS, with 1% lows of 40 FPS. Switching to DLSS 4.5 Performance increased the average to 56 FPS, while 1% lows improved to 48 FPS.
RTX 5060 Benchmark Results
| Resolution & Graphics Settings | Average FPS | 1% Low |
|---|---|---|
| 1080p High – Native | 77 | 56 |
| 1440p High – DLSS 4 Performance + PT + MFG 2X | 82 | 54 |
| 4K Medium – DLSS 4 Quality | 47 | 40 |
| 4K Medium – DLSS 4.5 Performance | 56 | 48 |
At 4K, DLSS 4.5 Performance provided a noticeable improvement over DLSS 4 Quality, increasing average FPS by approximately 19% in our testing.
Benchmark Video: Watch the full RTX 5060 gameplay test to see all graphics settings, Ray Tracing, Path Tracing, and DLSS configurations.
NVIDIA GeForce RTX 5070 Performance
The GeForce RTX 5070 was tested at 1080p, 1440p, and 4K resolutions, featuring different graphics presets, Ray Tracing, Path Tracing, DLSS 4, DLSS 4.5, and Multi Frame Generation.
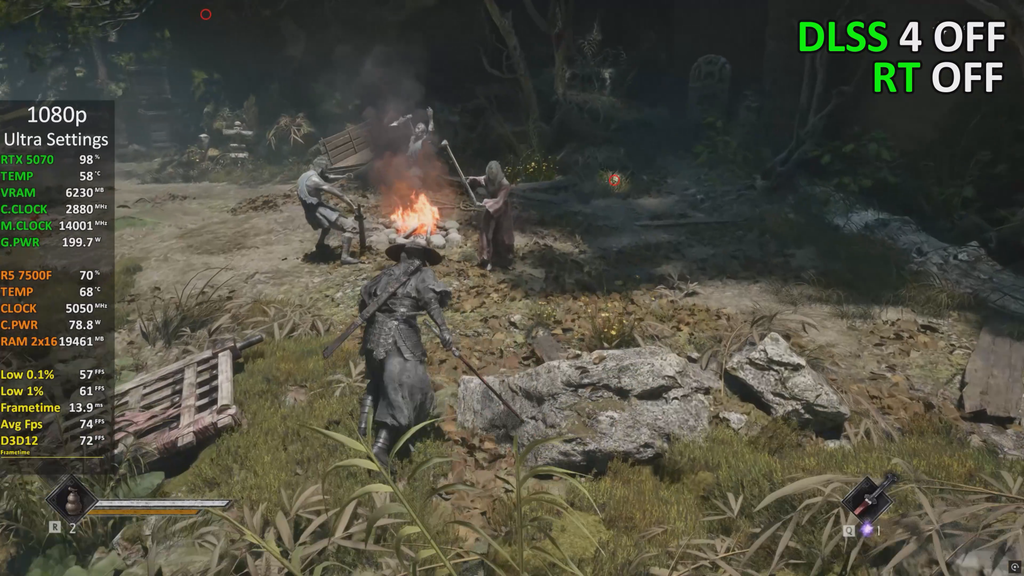
Starting with 1080p, the RTX 5070 delivered an average of 74 FPS, with 1% lows of 61 FPS using the Ultra graphics preset and native rendering.
At 1440p, we enabled Path Tracing alongside DLSS 4 Balanced and Multi Frame Generation 6X using the Very High preset. This configuration delivered an impressive 204 FPS on average, with 1% lows of 142 FPS.
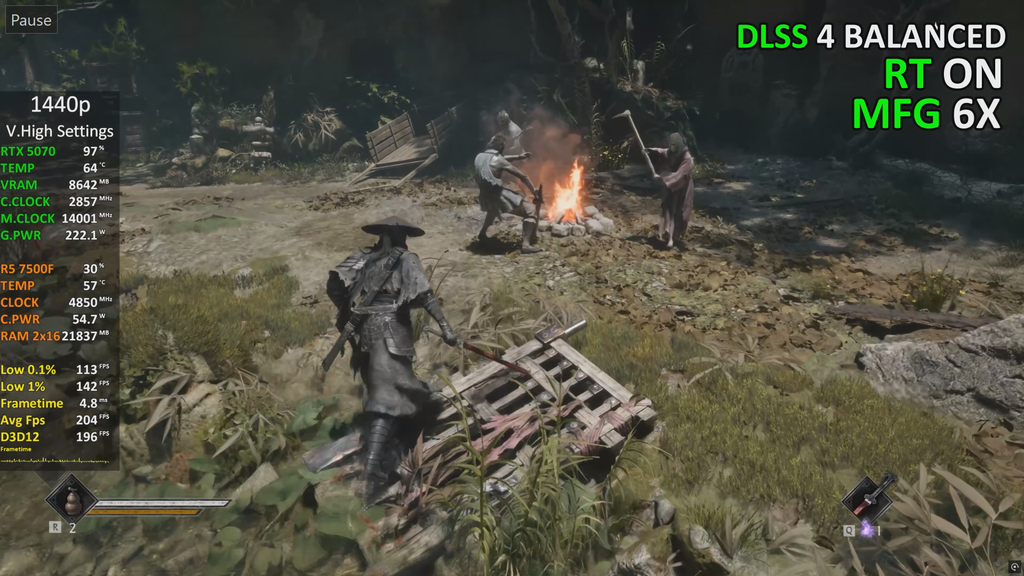
For the 4K test, we used the High graphics preset with DLSS 4.5 Performance, Ray Tracing, and Multi Frame Generation 2X. The RTX 5070 achieved an average of 76 FPS, with 1% lows of 63 FPS.
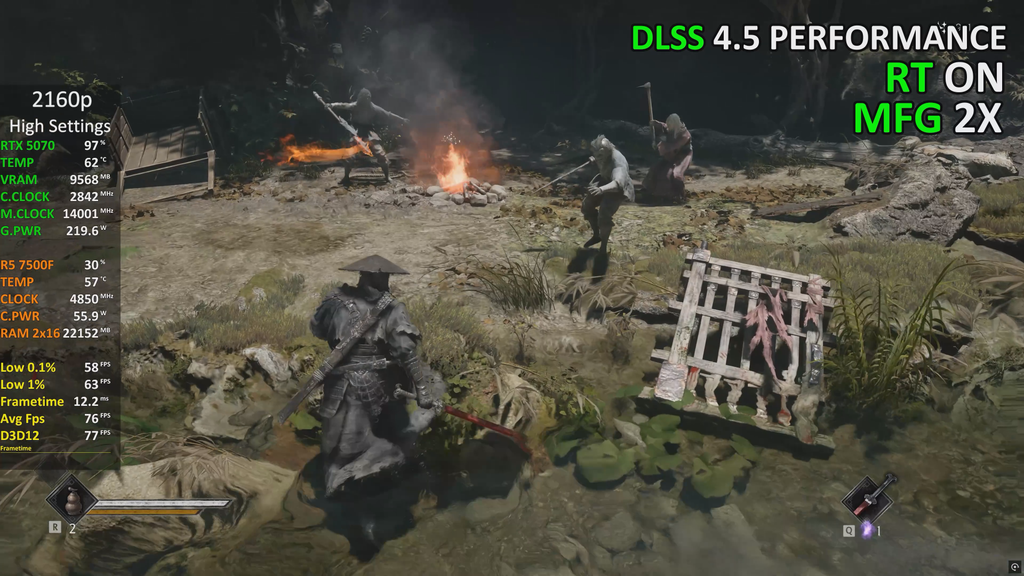
These results highlight the RTX 5070’s ability to handle demanding rendering features while taking advantage of NVIDIA’s upscaling and frame generation technologies.
RTX 5070 Benchmark Results
| Resolution & Graphics Settings | Average FPS | 1% Low |
|---|---|---|
| 1080p Ultra – Native | 74 | 61 |
| 1440p Very High – DLSS 4 Balanced + PT + MFG 6X | 204 | 142 |
| 4K High – DLSS 4.5 Performance + RT + MFG 2X | 76 | 63 |
Benchmark Video: Watch the full RTX 5070 gameplay test for additional graphics settings, Ray Tracing, Path Tracing, DLSS, and Multi Frame Generation results.
AMD Radeon RX 9070 Performance
The Radeon RX 9070 was tested at 1080p, 1440p, and 4K resolutions using different graphics presets, AMD FSR 4.1 upscaling, Ray Tracing, Path Tracing, and Frame Generation.
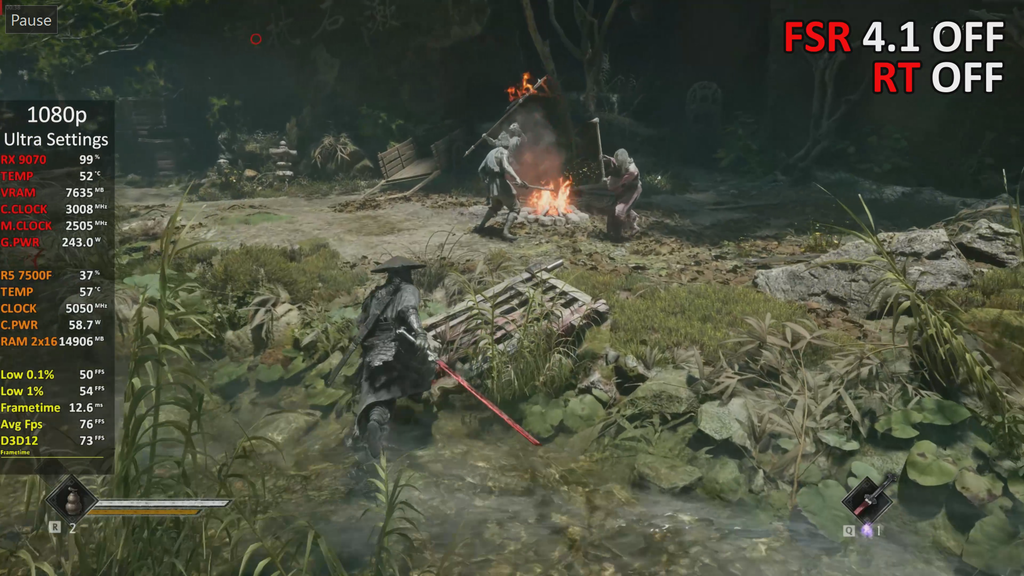
Starting at 1080p, the RX 9070 delivered an average of 76 FPS, with 1% lows of 54 FPS, using the Ultra graphics preset and native rendering.
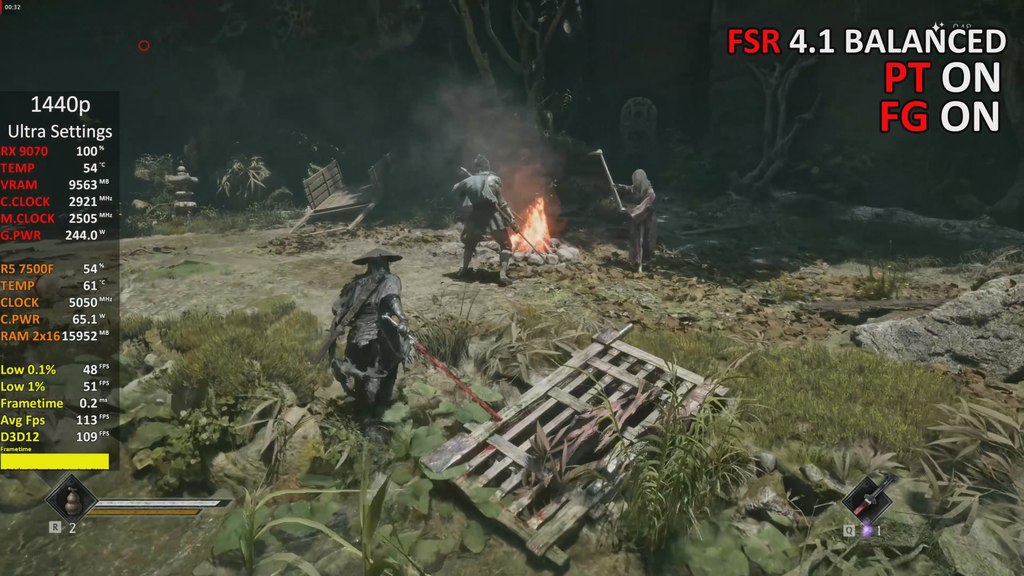
At 1440p, we enabled Path Tracing alongside FSR 4.1 Balanced and Frame Generation using the Ultra preset. This configuration achieved an average of 113 FPS, with 1% lows of 51 FPS.
Moving to 4K, we tested the High graphics preset with FSR 4.1 Performance, Path Tracing, and Frame Generation enabled. The RX 9070 delivered an average of 129 FPS, with 1% lows of 58 FPS.
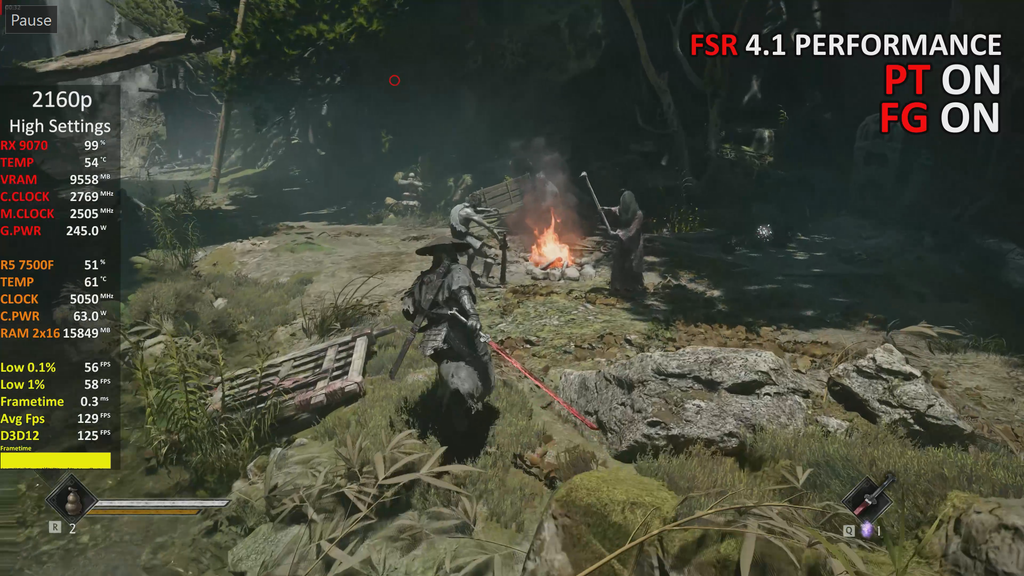
These results demonstrate how AMD’s FSR upscaling and Frame Generation technologies can help improve displayed frame rates when using demanding rendering features such as Path Tracing.
RX 9070 Benchmark Results
| Resolution & Graphics Settings | Average FPS | 1% Low |
|---|---|---|
| 1080p Ultra – Native | 76 | 54 |
| 1440p Ultra – FSR 4.1 Balanced + PT + FG | 113 | 51 |
| 4K High – FSR 4.1 Performance + PT + FG | 129 | 58 |
Benchmark Video: Watch the full RX 9070 gameplay test for additional graphics settings, Ray Tracing, Path Tracing, FSR 4.1, and Frame Generation results.
GPU Performance Comparison: Native vs Advanced Rendering
The three graphics cards were tested across multiple resolutions and graphics configurations in Phantom Blade Zero. To make the results easier to understand, we have separated native rendering performance from tests using advanced rendering technologies.
Native Rendering Performance
The following results show performance without upscaling or Frame Generation.
| GPU | Resolution & Graphics Preset | Average FPS | 1% Low |
|---|---|---|---|
| RTX 5060 | 1080p High – Native | 77 | 56 |
| RTX 5070 | 1080p Ultra – Native | 74 | 61 |
| RX 9070 | 1080p Ultra – Native | 76 | 54 |
All three GPUs delivered similar average frame rates in these selected 1080p tests. However, the RTX 5060 was tested using the High preset, while the RTX 5070 and RX 9070 used Ultra. Therefore, these results provide a reference for each GPU rather than a perfectly matched performance comparison.
Ray Tracing, Path Tracing & Frame Generation
The next results demonstrate how each GPU performs with more demanding rendering features and supported upscaling technologies.
| GPU | Resolution & Graphics Settings | Average FPS | 1% Low |
|---|---|---|---|
| RTX 5060 | 1440p High – DLSS 4 Performance + PT + MFG 2X | 82 | 54 |
| RTX 5070 | 1440p Very High – DLSS 4 Balanced + PT + MFG 6X | 204 | 142 |
| RX 9070 | 1440p Ultra – FSR 4.1 Balanced + PT + FG | 113 | 51 |
| RTX 5060 | 4K Medium – DLSS 4 Quality | 47 | 40 |
| RTX 5060 | 4K Medium – DLSS 4.5 Performance | 56 | 48 |
| RTX 5070 | 4K High – DLSS 4.5 Performance + RT + MFG 2X | 76 | 63 |
| RX 9070 | 4K High – FSR 4.1 Performance + PT + FG | 129 | 58 |
Important: Frame Generation and Multi Frame Generation were enabled in the applicable tests. Their Average FPS and 1% Low figures represent the displayed frame rates, including generated frames. These numbers should not be interpreted as native rendering performance.
The graphics presets, upscaling modes, ray tracing settings, and Frame Generation multipliers also differ between configurations. As a result, these figures illustrate how each GPU handled its selected settings and technologies, rather than establishing a direct performance ranking.
For a closer look at the gameplay experience, refer to the individual GPU benchmark sections and their accompanying footage.